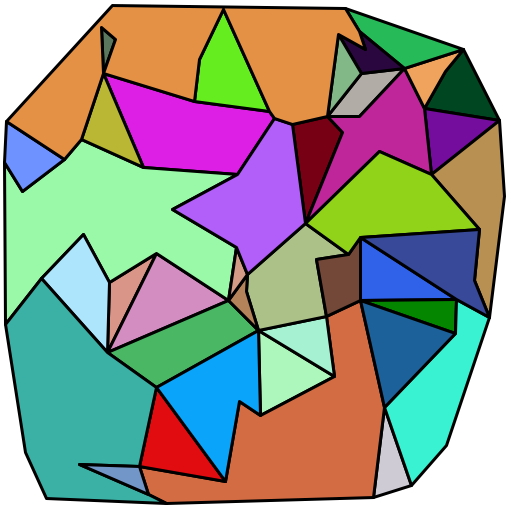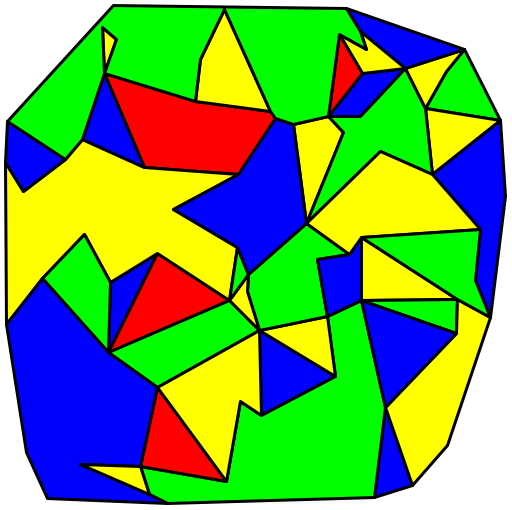
Imagine a map in which countries (or states, or counties) are rendered in contrasting colors, with no two neighboring countries the same. What is the minimum number of colors required to create such a map? Some maps can be colored with only 2 or 3 colors. It turns out that any map with contiguous (one-piece) tiles can be colored with no more than 4 colors. This perhaps surprising fact was first suggested in 1852, but not proven until 1976 (with the help of a computer program that worked out more than a thousand base cases).
We can find a four-coloring for an arbitrary map via exhaustive search: enumerate all the possible colorings and check each one to see whether any adjacent tiles are colored the same. Again perhaps surprisingly, there is no known technique that is fundamentally faster than this—and in fact there cannot be, unless the P=NP conjecture (the most famous open problem in computer science) turns out to be true, which pretty much no one believes. For more information (if you’re curious), check out the article at Wikipedia.
Fortunately, most maps have a lot of possible four-colorings, and even exhaustive search tends to come up with one of them up pretty rapidly. For this, the second programming project of the semester, we are providing you with starter code that generates random maps (rather pretty ones, if I do say so myself), which you must then four-color. You’ll do so using recursive backtracking, a form of exhaustive search. As in the first project, the amount of code you will need to write is very small. Feel free to brainstorm with classmates, but please write your own individual code.

The program that generates maps is written in
Java. You’ll need to have Java (version 1.5 or newer)
installed on your machine in order to run this program. If you
don’t have Java, you can get it from java.sun.com
for Windows or Linux, or from
apple.com/java for
Mac OS. If you double-click on the Map.jar file,
it will display a window in which you can cycle through pictures.
You can try it out in your browser by clicking HERE. You can also run it from a command-line
shell or from a Python program. These latter options allow you to
specify command-line arguments that tell the program to gnerate a single
map and print it out (in the form of a bunch of numbers) instead of
drawing a picture.
The Python starter code we’re giving you
uses the print-it-out option, through a somewhat cryptic invocation of the
Popen function from the subprocess module.
You needn’t worry about how this call works. Its effect is
to create a file
object, MAP, from which to read the output of the Java program.
That output consists of
If that all seems a little daunting, rest easy: the Python starter code
reads all of this in and uses it to create a data
abstraction—class Map—that you can
use directly.
When you create an instance of this class,
m = Map()
the initializer runs the external Java program and creates a list
self.tiles, each element of which is an instance of class
Tile.
Each Tile instance in turn contains a self.neighbors
list that comprises the indices of the adjacent tiles. The
Tile instance also contains a
variable self.index (an integer between 0 and
M−1) that indicates which tile it is, and a variable
polygon that is used to render the tile on your screen.
When you start up the program, you’ll find that it immediately (well,
after a brief pause) displays an initial map. If you click on the map
twice (pause a little between clicks) it will display another map.
The first click causes the program to execute method
Map.fourcolor(), which is currently empty.
The second click causes the program to create a new map.
As in the previous assignment, the starter code uses the simple Zelle graphics.py
module; you’ll need a copy of this in a place where Python can find it.
To end the mouse click cycle, type ^C (control-C) in IDLE’s
console window. To start again, call run(seed), where
seed is an arbitrary integer that determines which picture
you’ll start with.
Your job is to implement
Map.fourcolor() and whatever else it needs to
call. You’ll probably find it helpful to do most of the
work in a recursive method in class Tile. I’ve left a
placeholder for this, with a few suggestions in a comment; take a look.
The total amount of code you’ll have to write is quite small, and will
strongly resemble what we did in class for the water-jug problem.
Please read the grading
standards web page carefully and follow its instructions.
In particular, note that you will need to create a README.txt
or README.pdf file, and you will need to turn your code in
using Blackboard.
For extra credit (counted at the end of the semester; may raise your final grade), you might consider the following possibilities.
Map.jar:
L, the command
L.sort(key=functionName, reverse=True)
will put the elements of L into reverse order, where
functionName is the name of a function (perhaps one you wrote
yourself) that inspects an element and returns a value on which to sort
(like the number of neighbors, if the element is a tile).
